
Learn how to navigate though BeCrop Portal
You already have your BeCrop Portal account and are logged in. If you don't remember how, you can review more information here.
The first time you log in you will see the Dashboard, below we will explain all the elements in detail so you can feel comfortable navigating BeCrop Portal.
Watch a quick video about the dashboard:
If I have several crops, how do I change the crop that I am viewing?
⚠️ Remember! BeCrop and The Portal tools are crop-specific, as they allow you to assess crop-specific metrics such as disease risk, etc…
You can change the crop in question by hovering your cursor on the bottom left of the Portal. A list of other crops on your account will pop-up, and you can click on the crop that you are interested in viewing.
The Dashboard elements
On this page you will see a summary of your account, along with a snapshot of the latest news, updates, required actions, and more.
- Notifications - On the top you of the dashboard you can see notifications related with you parcels. Samples associated and the pending parcels to analyse.
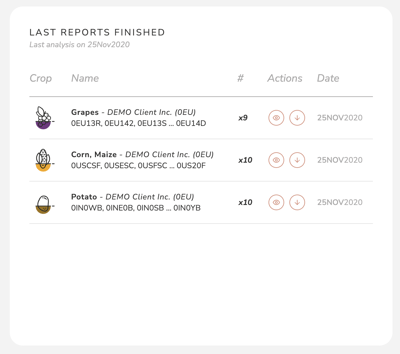
- Last Reports Finished - You can download reports in batches, or see all of your samples by clicking on the download icon next to each line, which represents a batch of samples.
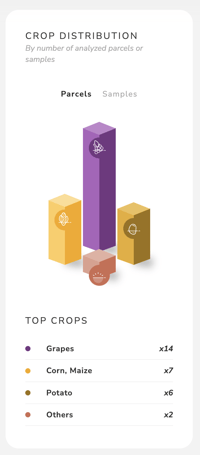
- Crop Distribution - Here you can see the distribution of the analyses you have done based on crops.
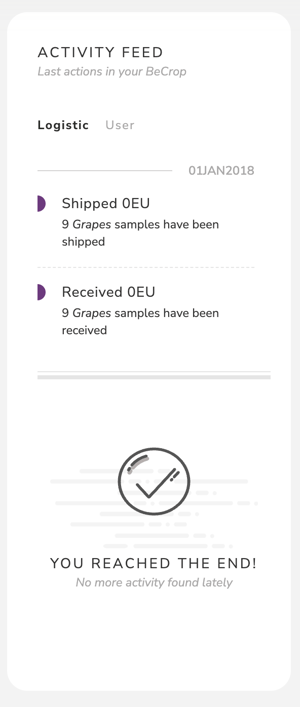
- Activity Feed - Get all the information about your samples
- Menu (Next to your picture profile) - Here you can change the language of the BeCrop Portal if you needed. You can select english, spanish or french. Also you can send invitation and manage your team.

Watch the video to learn more about the menu:
On the bottom of the dashboard you can see:
- Disease overview - You can see the diseases that are detected in your samples during specific years. And if you click on the graphic you can see the sample and the level that were found.

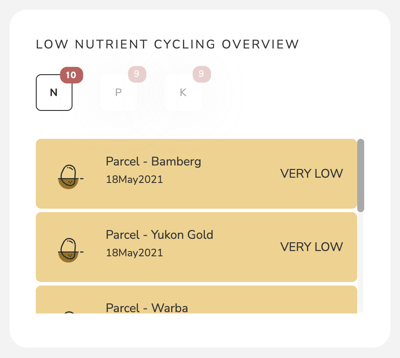
- Low Nutrient cycling overview - Here you can see how your parcels are related with the macronutrients N (nitrogen), P(phosphorus) and K (potassium). You can see the parcel name plus the level found.
- Parcel efforts - Here, you can see a sample distribution based on the crops you have analysed. The parcel name is also displayed so you can quickly discover where you are spending more effort in analysing.

There are other tools in the portal
The BeCrop Portal contains more tools. Here, you can find a quick description of each one. However, if you would like to learn more about them, just click on the link to find a detailed guide.
Maps - Here you can find all your parcels and do quick comparisons between them.
👉 Learn more about the MAP tool
Elements - Here, you can find your proposals, your parcels, and your reports.
ToolBox - Here you can find the advanced features, that will provide you support when doing an analysis of your samples on the BeCrop Portal :
- Explorer Tool - Use it to know the specific species found in a sample. For example, to answer the following questions:
- Which is the top microorganism found in my sample?
- Do I have Saccharomyces in a certain sample?
- Co-Ocurerence tool - Use it to know common and unique species in groups of samples. For example, to answer the following questions:
- How many microorganisms were shared in last month's samples?
- Is Lachancea Thermotolerans common to all my samples?
- Do my biodynamic parcels have species that my other parcels don´t have?
- Abundance BOX PLOT (MO WBP) tool - Use the tool to discover differences between relative abundance for a specific microorganism among sample clusters. For example, to answer the following questions:
- Which are the minimum and maximum values of a MO between different clusters or samples?
- Are there a similar relative abundance of a specific MO between different sample groups?
- Raw Rank Box Plot (Metric WBP) tool - Use it to discover the raw data distribution of your samples grouped by clusters. For example, to answer the following questions:
- Which is the minimum and maximum value in your own customized clusters?
- Are there similar values in the indexes of my report for different sample clusters?
- Which is the index that differentiates my biodynamic parcel from the other ones?
- HeatMap - Use it to compare levels of certain parameters between different samples. For example, to answer the following questions:
- Which of my samples have Very High biodiversity?
- Is there any disease risk present in all my samples?
- Which of my parcels has problems in its Carbon Nutrition movement?
👉 Learn more about the TOOLBOX tools
Support - Here, you can connect with our fabulous Customer Success team to solve your problems or questions about BeCrop Trials or your samples.
🔖 Articles in this category
Would you like to learn more about BeCrop®?
Check these resources:
📕 Soil Secrets: Discover Your Land's Full Potential with Soil Microbiome Analysis
📺 Crop Disease Risk Management with BeCrop®
📰 The Importance of Soil Testing in Preseason Planning in Agriculture